Prometheus remote write
Caution
This is an experimental module.
While we intend to keep experimental modules as stable as possible, we may need to introduce breaking changes. This could happen at future k6 releases until the module becomes fully stable and graduates as a k6 core module. For more information, refer to the versioning and stability guarantees document.
Experimental modules maintain a high level of stability and follow regular maintenance and security measures. Feel free to open an issue if you have any feedback or suggestions.
Prometheus remote write is a protocol that makes it possible to reliably propagate data in real-time from a sender to a receiver. It has multiple compatible implementations and storage integrations.
For instance, when using the experimental-prometheus-rw output, k6 can send test-result metrics to the remote-write endpoint and store them in Prometheus.
The output, during the k6 run execution, gets all the generated time-series data points for the
k6 metrics.
It then generates the equivalent Prometheus time series and sends them to the Prometheus remote write endpoint.
Metrics mapping
All k6 metric types are converted into an equivalent Prometheus metric type. The output maps the metrics into time series with Name labels. As much as possible, k6 respects the naming best practices that the Prometheus project defines:
- All time series are prefixed with the
k6_namespace. - All time series are suffixed with the base unit of the sample value (if k6 knows what the base unit is).
- Trends and rates have the relative suffixes, to make them more discoverable.
Trend metric conversions
This output converts k6 Trend metrics to Prometheus Counter and Gauge metrics. k6 aggregates trend metric data before sending it to Prometheus. The reasons for aggregating data are:
- Prometheus stores data in a millisecond precision (
ms), but k6 metrics collect data points with higher accuracy, nanosecond (ns). - A load test could generate vast amounts of data points. High-precision raw data could quickly become expensive and complex to scale and is unnecessary when analyzing performance trends.
Counter and gauges
By default, Prometheus supports Counter and Gauge Metric types. Therefore, this option is the default of this output and converts all the k6 Trend metrics to Counter and Gauges Prometheus metrics.
You can configure how to convert all the k6 trend metrics with the K6_PROMETHEUS_RW_TREND_STATS option that accepts a comma-separated list of stats functions: count, sum, min, max, avg, med, p(x). The default is p(99).
Given the list of stats functions, k6 converts all trend metrics to the respective math functions as Prometheus metrics.
For example, K6_PROMETHEUS_RW_TREND_STATS=p(90),p(95),max transforms each trend metric into three Prometheus metrics as follows:
k6_*_p90k6_*_p95k6_*_max
This option provides a configurable solution to represent Trend metrics in Prometheus but has the following drawbacks:
- Convert a k6
Trendmetric to several Prometheus metrics. - It is impossible to aggregate some gauge values (especially percentiles).
- It uses a memory-expensive k6 data structure.
Send test metrics to a remote write endpoint
To use remote write in Prometheus 2.x, enable the feature flag –web.enable-remote-write-receiver. For remote write storage options, refer to the Prometheus docs.
Set up a running remote write endpoint and ensure k6 can reach it.
Run your k6 script with the
--outflag and the URL of the remote write endpoint:Trend stats
K6_PROMETHEUS_RW_SERVER_URL=http://localhost:9090/api/v1/write \
k6 run -o experimental-prometheus-rw script.js
HTTP Basic Authentication
K6_PROMETHEUS_RW_SERVER_URL=http://localhost:9090/api/v1/write \
K6_PROMETHEUS_RW_USERNAME=USERNAME \
K6_PROMETHEUS_RW_PASSWORD=PASSWORD \
k6 run -o experimental-prometheus-rw script.js
Optionally, pass
K6_PROMETHEUS_RW_TREND_STATSto query additional stats for trend metrics. The default isp(99).K6_PROMETHEUS_RW_SERVER_URL=http://localhost:9090/api/v1/write \ K6_PROMETHEUS_RW_TREND_STATS=p(95),p(99),min,max \ k6 run -o experimental-prometheus-rw script.js
When running the previous k6 run commands, k6 starts sending time-series metrics to Prometheus.
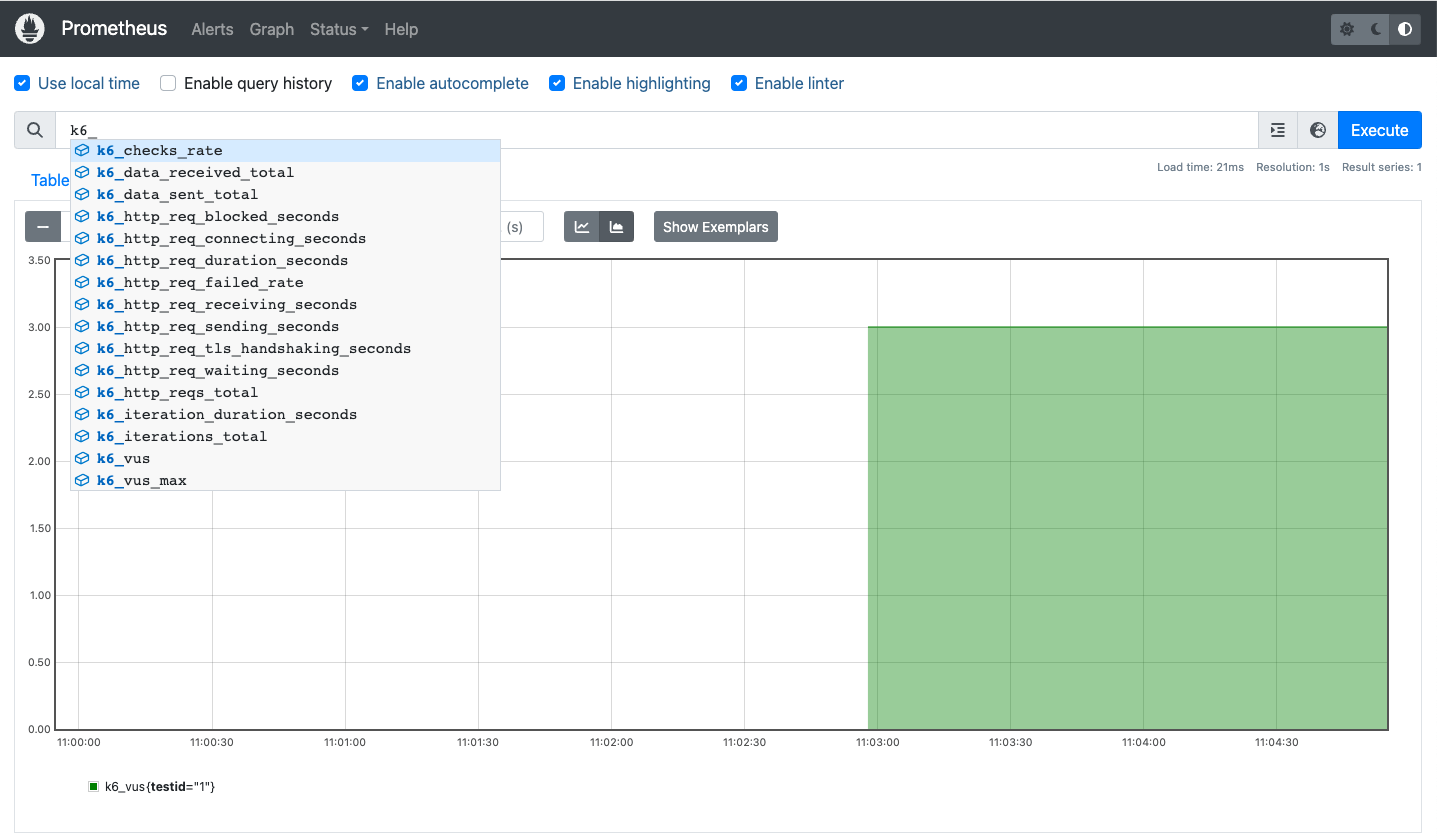
All the time series have a k6_ prefix.
In the Prometheus Web UI, they appear like this:
Options
k6 has special options for remote write output.
Stale trend metrics
This k6 output can mark the time series at the end of the test as stale.
To enable the stale marker option, set the K6_PROMETHEUS_RW_STALE_MARKERS environment variable to true.
By default, the metrics are active for 5 minutes after the last flushed sample. They are automatically marked as stale after. For details about staleness, refer to the Prometheus docs.
Time series visualization
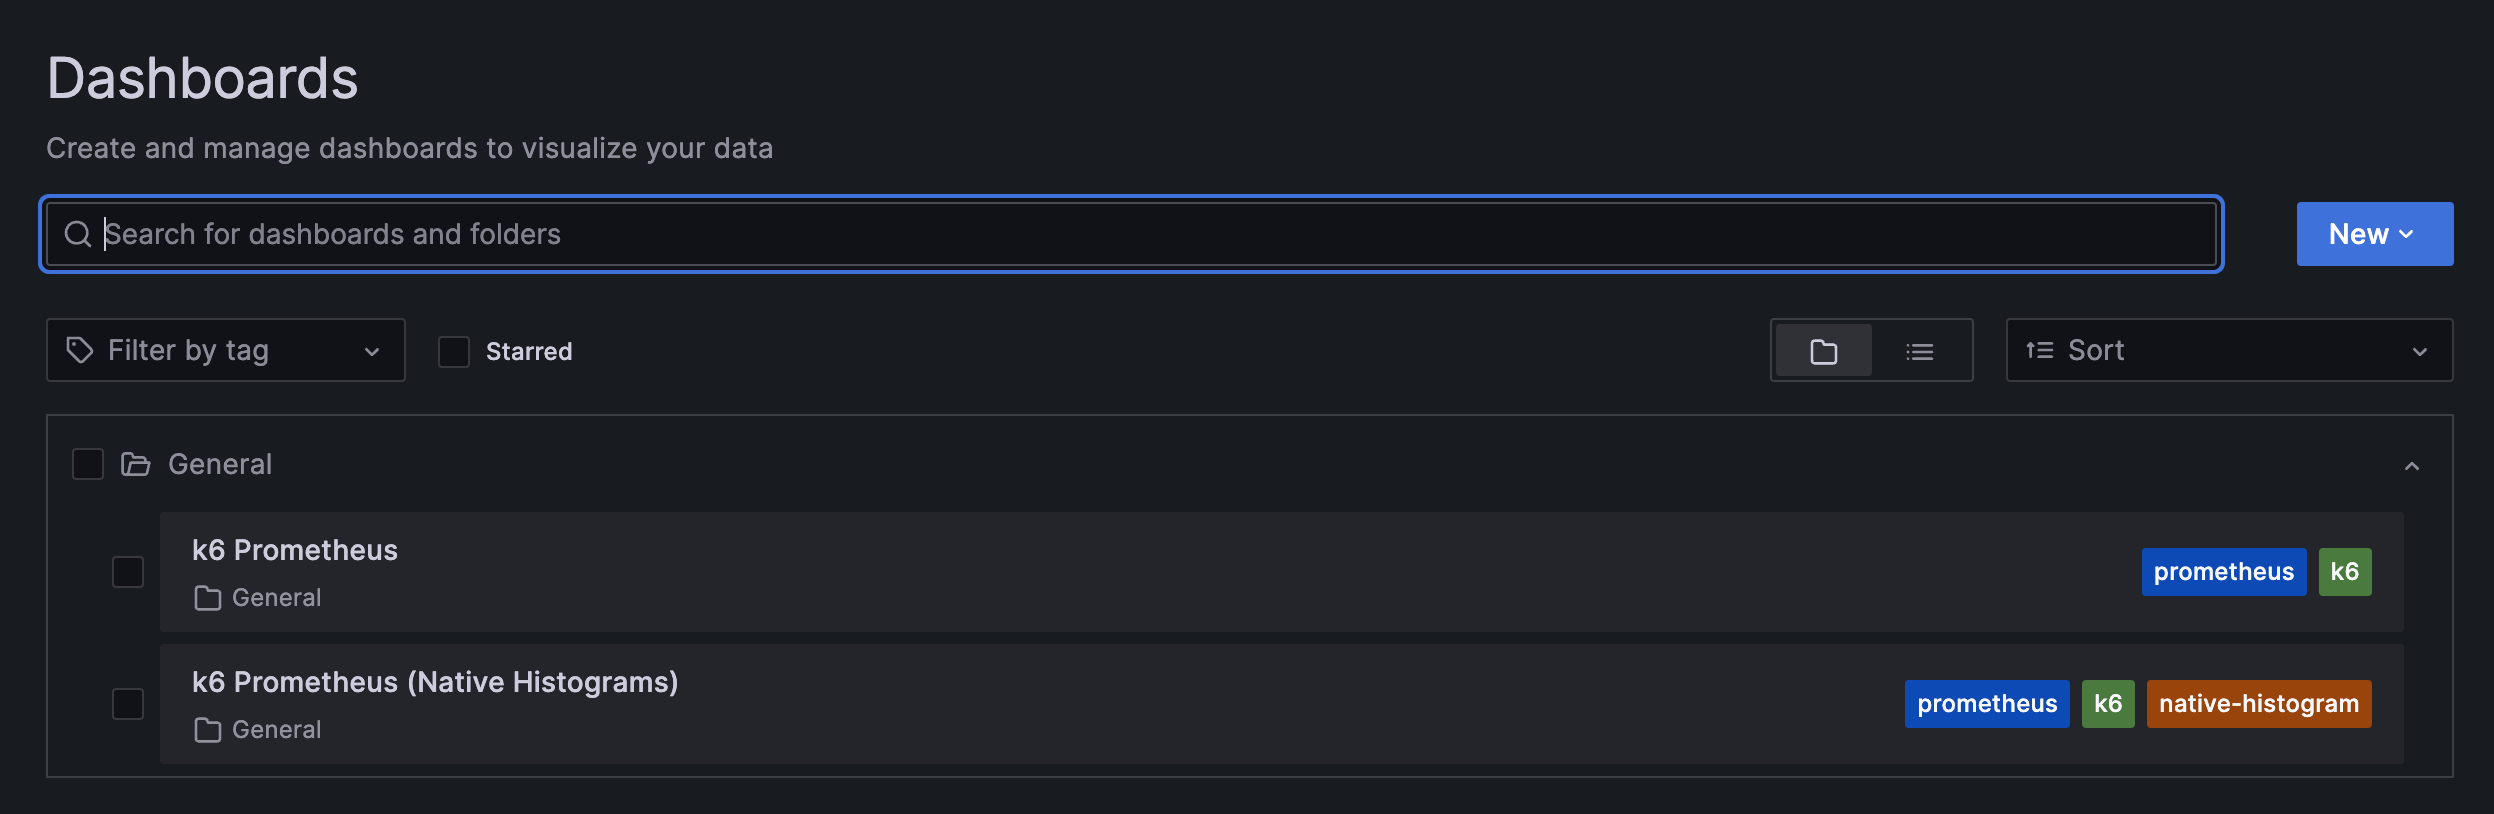
To visualize time series with Grafana, you can use the Explore UI or import any of the existing pre-built dashboards:
If you are a Grafana Cloud user, please refer to the Grafana Cloud Prometheus docs.
For a local environment, the xk6-output-prometheus-remote repository includes a Docker Compose setup that provisions the k6 Prometheus dashboard:
Docker compose example
Clone the repository to get started and follow these steps for using the docker-compose.yml file that starts Prometheus and Grafana:
Start the docker compose environment.
docker compose up -d prometheus grafana# Output Creating xk6-output-prometheus-remote_grafana_1 ... done Creating xk6-output-prometheus-remote_prometheus_1 ... donePrometheus starts with the remote write receiver enabled.
Run the k6 test with one of the options detailed on Send test metrics to a remote write endpoint.
Trend stats
K6_PROMETHEUS_RW_TREND_STATS=p(95),p(99),min,max \
k6 run -o experimental-prometheus-rw script.js
Optionally, you can set the
testidtag as a wide test tag to segment metrics into discrete test runs and filter specific test results on the pre-built Grafana dashboards or in PromQL queries.testidcan be any unique string that let you clearly identify the test run.Trend stats
K6_PROMETHEUS_RW_TREND_STATS=p(95),p(99),min,max \
k6 run -o experimental-prometheus-rw --tag testid=<SET-HERE-A-UNIQUE-ID> script.js
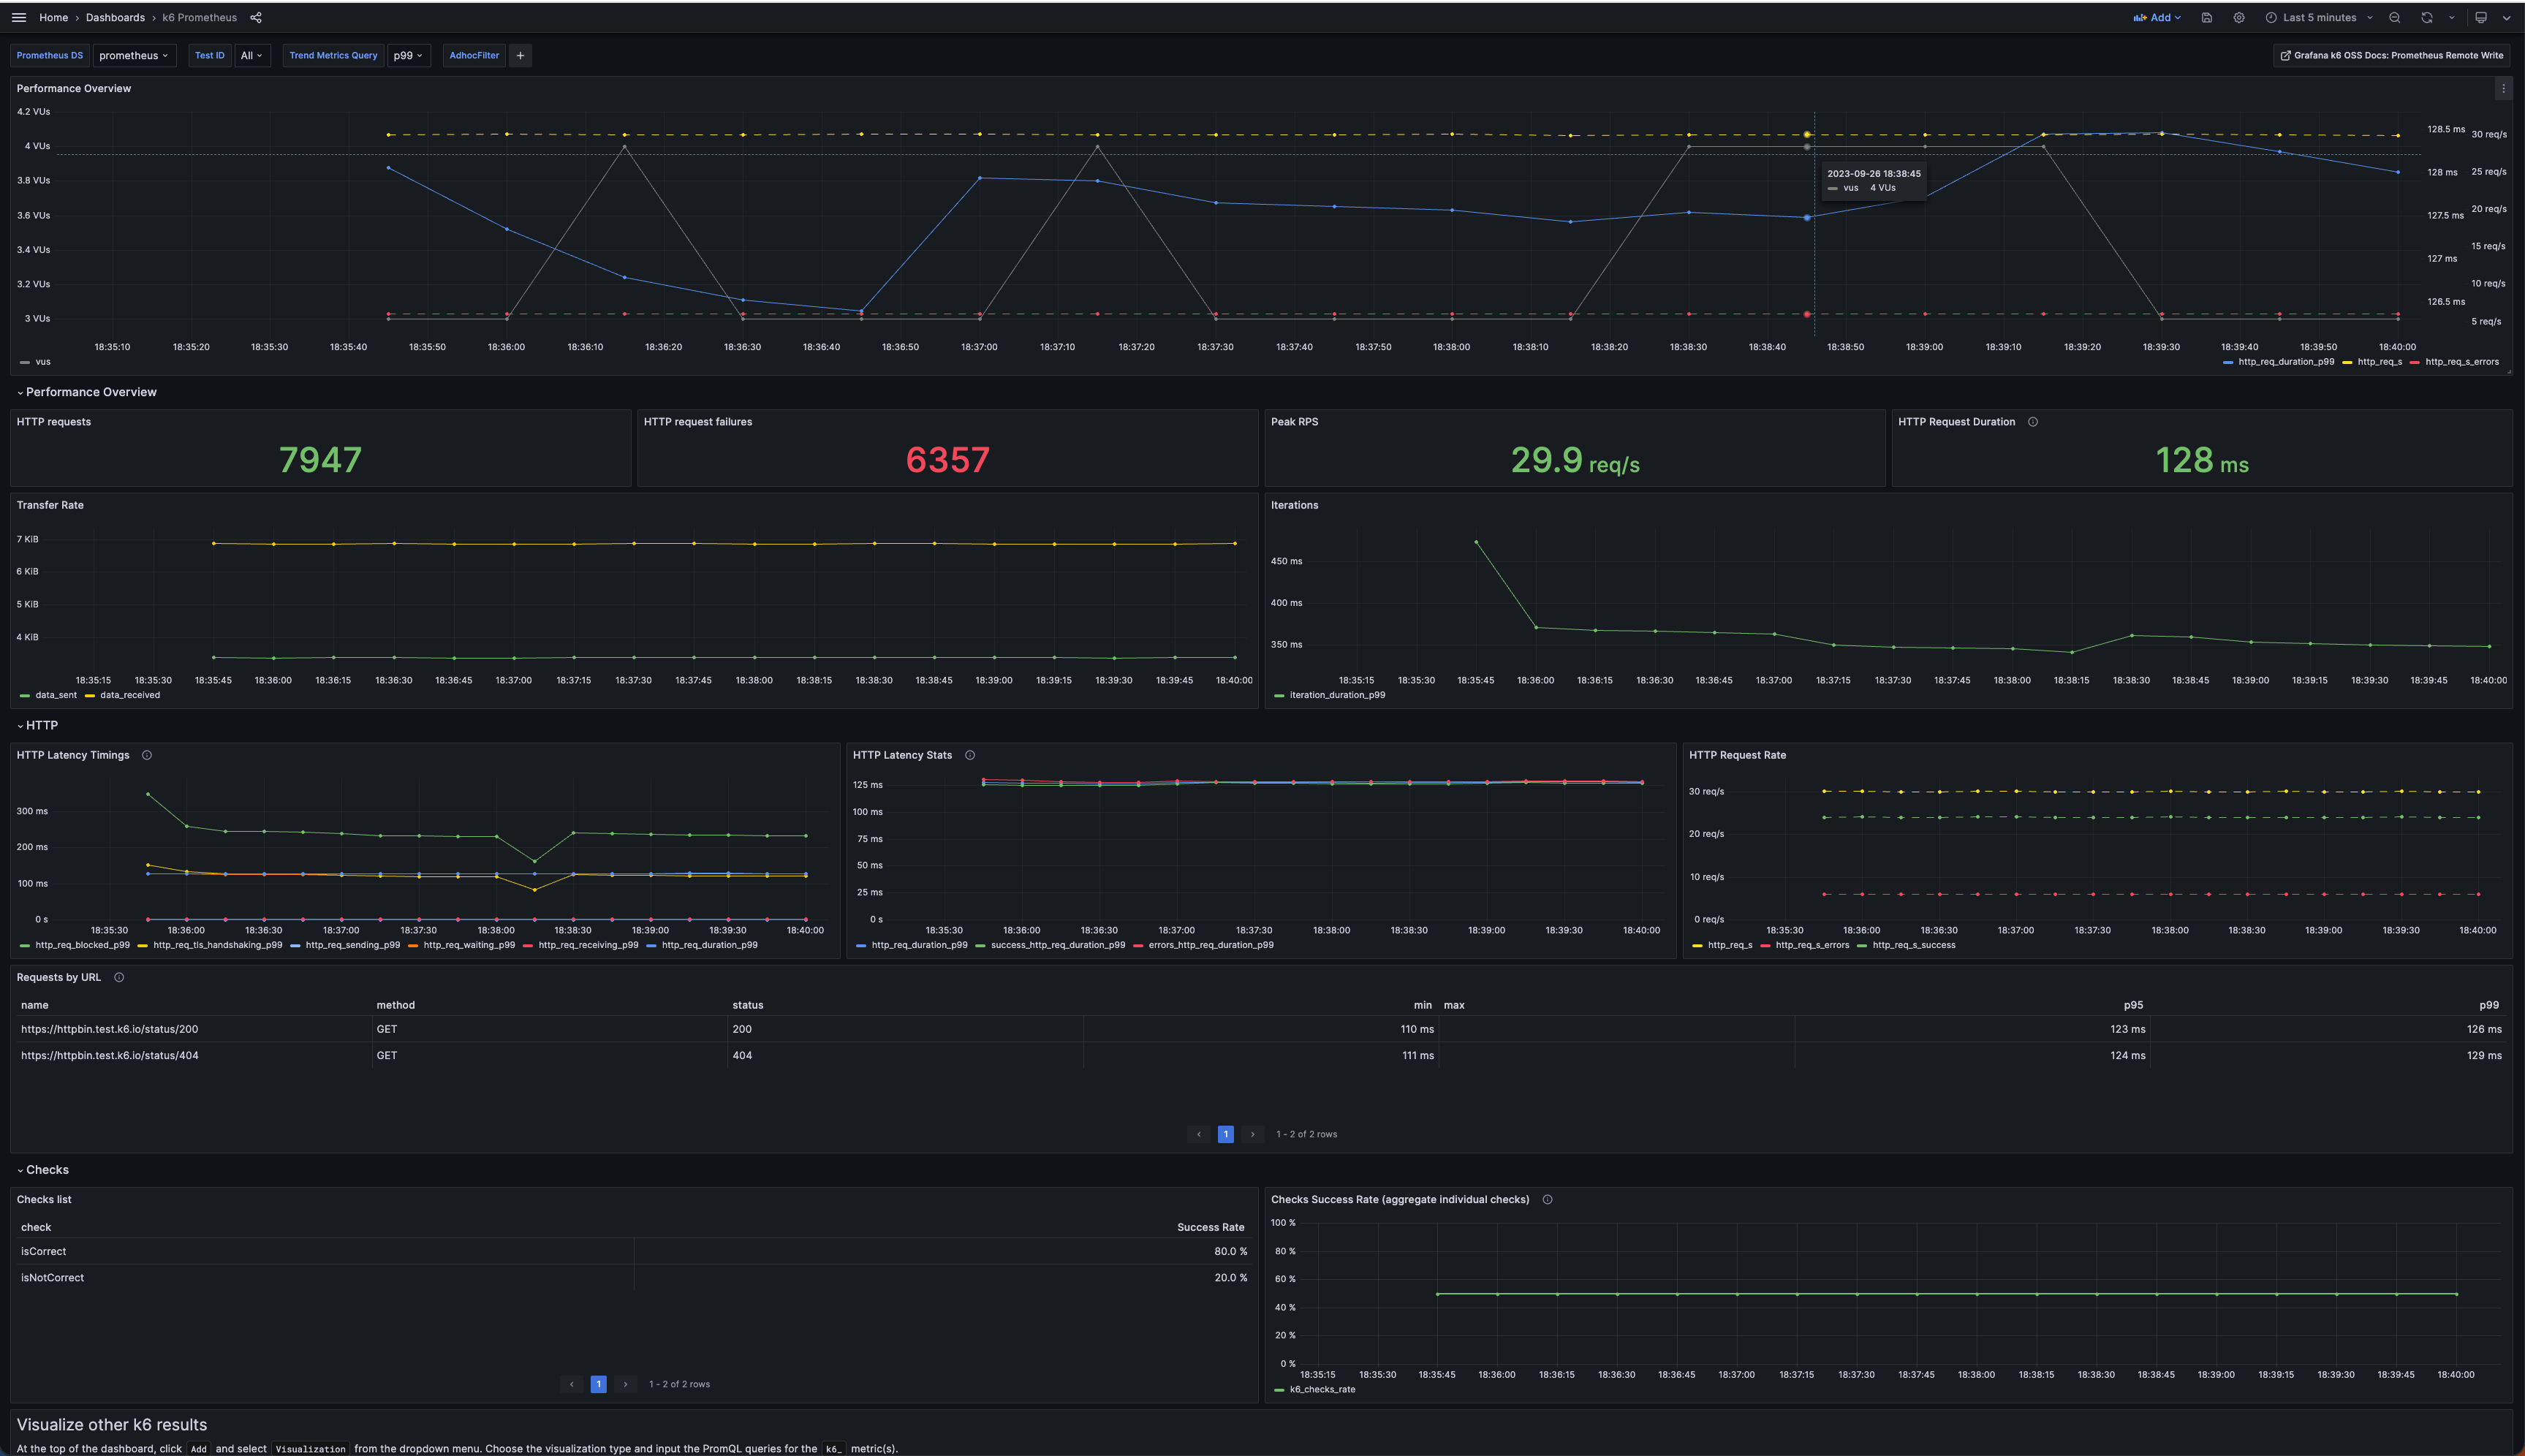
After running the test, visit http://localhost:3000 and select the k6 Prometheus dashboard.
![k6 Prometheus Dashboard]()